此文为转载,原地址见文章下方。
I have been working with Go for the better part of the year, implementing a scalable blockchain infrastructure at Orbs, and it’s been an exciting year. Over the course of 2018, we researched on which language to choose for our blockchain implementation. This led us to choose Go because of our understanding that it has a good community and an amazing tool-set.
In recent weeks we are entering the final stages of integration of our system. As in any large system, the later stage problems which include performance issues, in specific memory leaks, may occur. As we were integrating the system, we realized we found one. In this article I will touch the specifics of how to investigate a memory leak in Go, detailing the steps taken to find, understand and resolve it.
The tool-set offered by Golang is exceptional but has its limitations. Touching these first, the biggest one is the limited ability to investigate full core dumps. A full core dump would be the image of the memory (or user-memory) taken by the process running the program.
We can imagine the memory mapping as a tree, and traversing that tree would take us through the different allocations of objects and the relations. This means that whatever is at the root is the reason for ‘holding’ the memory and not GCing it (Garbage Collecting). Since in Go there is no simple way to analyze the full core dump, getting to the roots of an object that does not get GC-ed is difficult.
At the time of writing, we were unable to find any tool online that can assist us with that. Since there exists a core dump format and a simple enough way to export it from the debug package, it could be that there is one used at Google. Searching online it looks like it is in the Golang pipeline, creating a core dump viewer of such, but doesn’t look like anyone is working on it. Having said that, even without access to such a solution, with the existing tools we can usually get to the root cause.
Memory Leaks
Memory leaks, or memory pressure, can come in many forms throughout the system. Usually we address them as bugs, but sometimes their root cause may be in design decisions.
As we build our system under emerging design principles, such considerations are not believed to be of importance and that is okay. It is more important to build the system in a way that avoids premature optimizations and enables you to perform them later on as the code matures, rather than over engineer it from the get-go. Still, some common examples of seeing memory pressure issues materialize are:
- Too many allocations, incorrect data representation
- Heavy usage of reflection or strings
- Using globals
- Orphaned, never-ending goroutines
In Go, the simplest way to create a memory leak is defining a global variable, array, and appending data to that array. This great blog post describes that case in a good way.
So why am I writing this post? When I was researching into this case I found many resources about memory leaks. Yet, in reality systems have more than 50 lines of code and a single struct. In such cases, finding the source of a memory issue is much more complex than what that example describes.
Golang gives us an amazing tool called pprof. This tool, when mastered, can assist in investigating and most likely finding any memory issue. Another purpose it has is for investigating CPU issues, but I will not go into anything related to CPU in this post.
go tool pprof
Covering everything that this tool does will require more than one blog post. One thing that took a while is finding out how to use this tool to get something actionable. I will concentrate this post on the memory related feature of it.
The pprof package creates a heap sampled dump file, which you can later analyze / visualize to give you a map of both:
- Current memory allocations
- Total (cumulative) memory allocations
The tool has the ability to compare snapshots. This can enable you to compare a time diff display of what happened right now and 30 seconds ago, for example. For stress scenarios this can be useful to assist in locating problematic areas of your code.
pprof profiles
The way pprof works is using profiles.
A Profile is a collection of stack traces showing the call sequences that led to instances of a particular event, such as allocation.
The file runtime/pprof/pprof.go contains the detailed information and implementation of the profiles.
Go has several built in profiles for us to use in common cases:
- goroutine — stack traces of all current goroutines
- heap — a sampling of memory allocations of live objects
- allocs — a sampling of all past memory allocations
- threadcreate — stack traces that led to the creation of new OS threads
- block — stack traces that led to blocking on synchronization primitives
- mutex — stack traces of holders of contended mutexes
When looking at memory issues, we will concentrate on the heap profile. The allocs profile is identical in regards of the data collection it does. The difference between the two is the way the pprof tool reads there at start time. Allocs profile will start pprof in a mode which displays the total number of bytes allocated since the program began (including garbage-collected bytes). We will usually use that mode when trying to make our code more efficient.
The heap
In abstract, this is where the OS (Operating System) stores the memory of objects our code uses. This is the memory which later gets ‘garbage collected’, or freed manually in non-garbage collected languages.
The heap is not the only place where memory allocations happen, some memory is also allocated in the Stack. The Stack purpose is short term. In Go the stack is usually used for assignments which happen inside the closure of a function. Another place where Go uses the stack is when the compiler ‘knows’ how much memory needs to be reserved before run-time (e.g. fixed size arrays). There is a way to run the Go compiler so it will output an analysis of where allocations ‘escape’ the stack to the heap, but I will not touch that in this post.
While heap data needs to be ‘freed’ and gc-ed, stack data does not. This means it is much more efficient to use the stack where possible.
This is an abstract of the different locations where memory allocation happens. There is a lot more to it but this will be outside the scope for this post.
Obtaining heap data with pprof
There are two main ways of obtaining the data for this tool. The first will usually be part of a test or a branch and includes importing runtime/pprof and then calling pprof.WriteHeapProfile(some_file) to write the heap information.
Note that WriteHeapProfile is syntactic sugar for running:
// lookup takes a profile namepprof.Lookup("heap").WriteTo(some_file, 0)According to the docs, WriteHeapProfile exists for backwards compatibility. The rest of the profiles do not have such shortcuts and you must use the Lookup() function to get their profile data.
The second, which is the more interesting one, is to enable it over HTTP (web based endpoints). This allows you to extract the data adhoc, from a running container in your e2e / test environment or even from ‘production’. This is one more place where the Go runtime and tool-set excels. The entire package documentation is found here, but the TL;DR is you will need to add it to your code as such:
import ( "net/http" _ "net/http/pprof")...func main() { ... http.ListenAndServe("localhost:8080", nil)}The ‘side effect’ of importing net/http/pprof is the registration the pprof endpoints under the web server root at /debug/pprof. Now using curl we can get the heap information files to investigate:
curl -sK -v http://localhost:8080/debug/pprof/heap > heap.outAdding the http.ListenAndServe() above is only required if your program did not have a http listener before. If you do have one it will hook on it and there is no need to listen again. There are also ways to set it up using a ServeMux.HandleFunc() which would make more sense to a more complex http-enabled program.
Using pprof
So we have collected the data, what now? As mentioned above, there are two main memory analysis strategies with pprof. One is around looking at the current allocations (bytes or object count), called inuse. The other is looking at all the allocated bytes or object count throughout the run-time of the program, called alloc. This means regardless if it was gc-ed, a summation of everything sampled.
This is a good place to reiterate that the heap profile is a sampling of memory allocations. pprof behind the scenes is using the runtime.MemProfile function, which by default collects allocation information on each 512KB of allocated bytes. It is possible to change MemProfile to collect information on all objects. Note that most likely, this will slow down your application.
This means that by default, there is some chance that a problem may happen with smaller objects that will slip under pprof’s radar. For a large codebase / long-running program, this is not an issue.
Once we collected the profile file, it is time to load it into the interactive console pprof offers. Do so by running:
> go tool pprof heap.outLet’s observe the information displayed
Type: inuse_spaceTime: Jan 22, 2019 at 1:08pm (IST)Entering interactive mode (type "help" for commands, "o" for options)(pprof)The important thing to note here is the Type: inuse_space . This means we are looking at allocation data of a specific moment (when we captured the profile). The type is the configuration value of sample_index, and the possible values are:
- inuse_space — amount of memory allocated and not released yet
- inuse_object s— amount of objects allocated and not released yet
- alloc_space — total amount of memory allocated (regardless of released)
- alloc_objects — total amount of objects allocated (regardless of released)
Now type top in the interactive, the output will be the top memory consumers
We can see a line telling us about Dropped Nodes, this means they are filtered out. A node is an object entry, or a ‘node’ in the tree. Dropping nodes is a good idea to reduce some noise, but sometimes it may hide the root cause of a memory issue. We will see an example of that as we continue our investigation.
If you want to include all data of the profile, add the -nodefraction=0 option when running pprof or type nodefraction=0 in the interactive.
In the outputted list we can see two values, flat and cum.
- flat means that the memory allocated by this function and is held by that function
- cum means that the memory was allocated by this function or function that it called down the stack
This information alone can sometimes help us understand if there is a problem. Take for example a case where a function is responsible of allocating a lot of memory but is not holding it. This would mean that some other object is pointing to that memory and keeping it allocated, meaning we may have a system design issue or a bug.
Another neat trick about top in the interactive window is that it is actually running top10. The top command supports topN format where N is the number of entries you want to see. In the case pasted above, typing top70 for example, would output all nodes.
Visualizations
While the topN gives a textual list, there are several very useful visualization options that come with pprof. It is possible to type png or gif and many more (see go tool pprof -help for a full list).
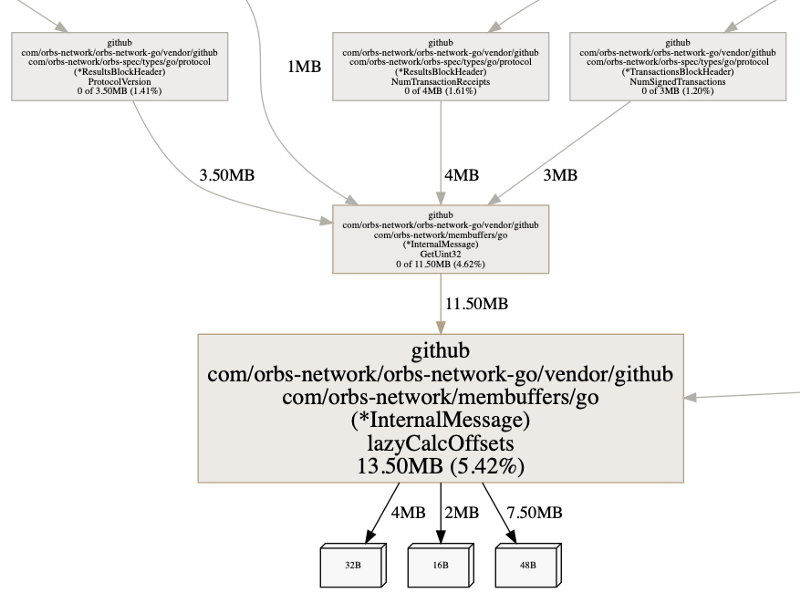
On our system, the default visual output looks something like:
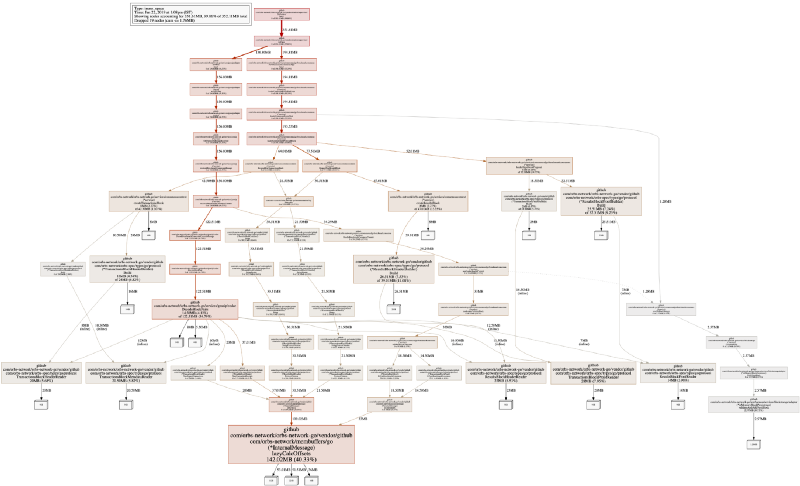
This may be intimidating at first, but it is the visualization of memory allocation flows (according to stack traces) in a program. Reading the graph is not as complicated as it looks. A white square with a number shows allocated space (and the cumulative of how much memory it’s taking right now on the edge of the graph), and each wider rectangle shows the allocating function.
Note that in the above image, I took a png off a inuse_space execution mode. Many times you should also take a look at inuse_objects as well, as it can assist with finding allocation issues.
Digging deeper, finding a root cause
So far, we were able to understand what is allocating memory in our application during runtime. This helps us get a feeling of how our program behaves (or misbehaves).
In our case, we could see that memory is retained by membuffers, which is our data serialization library. This does not mean that we have a memory leak at that code segment, it means that the memory is being retained by that function. It is important to understand how to read the graph, and the pprof output in general . In this case, understanding that when we serialize data, meaning that we allocate memory to structs and primitive objects (int, string), it is never released.
Jumping to conclusions or misinterpreting the graph, we could have assumed that one of the nodes on the path to serialization is responsible to retaining the memory, for example:
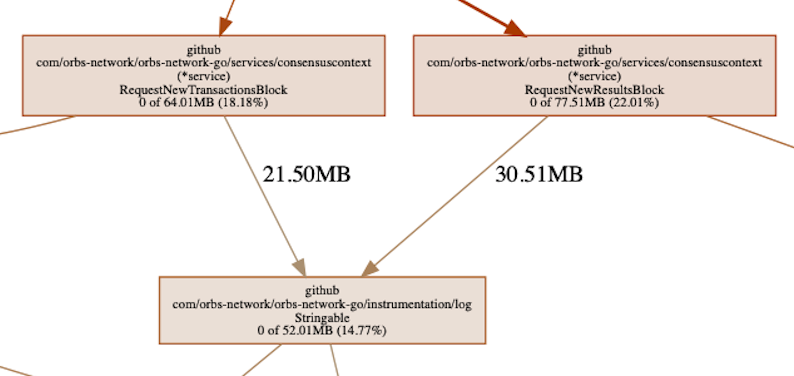
Somewhere in the chain we can see our logging library, responsible for >50MB of allocated memory. This is memory which is allocated by functions called by our logger. Thinking it through, this is actually expected. The logger causes memory allocations as it needs to serialize data for outputting it to the log and thus it is causing memory allocations in the process.
We can also see that down the allocation path, the memory is only retained by serialization and nothing else. Additionally, the amount of memory retained by the logger is about 30% of the total. The above tells us that, most likely, the problem is not with the logger. If it was 100%, or something close to it, then we should have been looking there — but it’s not. What it could mean is that something is being logged that shouldn’t be, but it is not a memory leak by the logger.
This is a good time to introduce another pprof command called list. It accepts a regular expression which will be a filter of what to list. The ‘list’ is in actual the annotated source code related to the allocation. In the context of the logger which we are looking into, we will execute list RequestNew as we would like to see the calls made to the logger. These calls are coming from two functions which happen to begin with the same prefix.
We can see that the allocations made are sitting in the cum column, meaning the memory allocated is retained down the call stack. This correlates to what the graph also shows. At that point it is easy to see that the reason the logger was allocating the memory is because we sent it the entire ‘block’ object. It needed to serialize some parts of it at the very least (our objects are membuffer objects, which always implement some String() function). Is it a useful log message, or good practice? Probably not, but it is not a memory leak, not at the logger end or the code which called the logger.
list can find the source code when searching for it under your GOPATH environment. In cases where the root it is searching for does not match, which depends on your build machine, you can use the -trim_path option. This will assist with fixing it and letting you see the annotated source code. Remember to set your git to the right commit which was running when the heap profile was captured.
So why is memory retained?
The background to this investigation was the suspicion that we have a problem — a memory leak. We came to that notion as we saw memory consumption was higher than what we would expect the system to need. On top of that, we saw it ever increasing, which was another strong indicator for ‘there is a problem here’.
At this point, in the case of Java or .Net, we would open some ‘gc roots’ analysis or profiler and get to the actual object which is referencing to that data, and is creating the leak. As explained, this is not exactly possible with Go, both because of a tooling issue but also because of Go’s low level memory representation.
Without going into details, we do not think Go retains which object is stored at which address (except for pointers maybe). This means that in actual, understanding which memory address represents which member of your object (struct) will require some sort of mapping to the output of a heap profile. Talking theory, this could mean that before taking a full core dump, one should also take a heap profile so the addresses can be mapped to the allocating line and file and thus the object represented in the memory.
At this point, because we are familiar with our system, it was easy to understand this is not a bug anymore. It was (almost) by design. But let’s continue to explore how to get the information from the tools (pprof) to find the root cause.
When setting nodefraction=0 we will get to see the entire map of the allocated objects, including the smaller ones. Let’s look at the output:
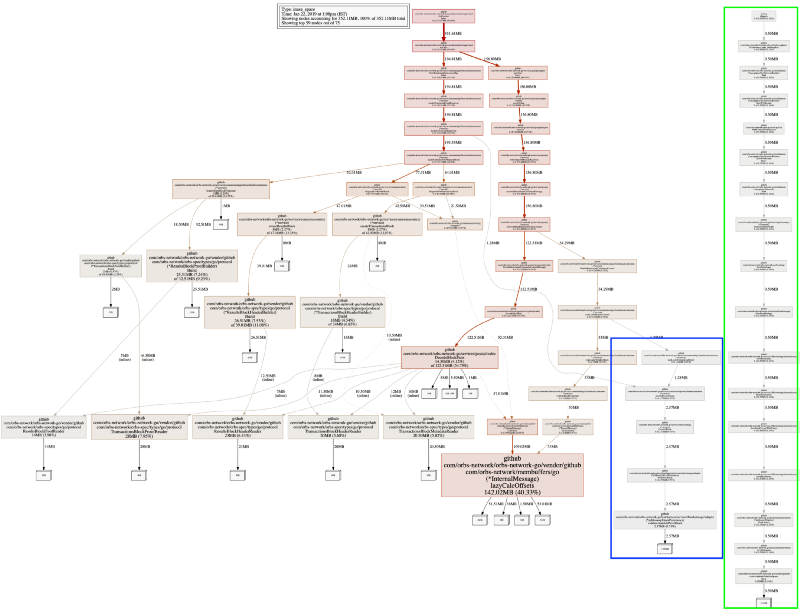
We have two new subtrees. Reminding again, pprof heap profile is sampling memory allocations. For our system that works — we are not missing any important information. The longer new tree, in green, which is completely disconnected from the rest of the system is the test runner, it is not interesting.
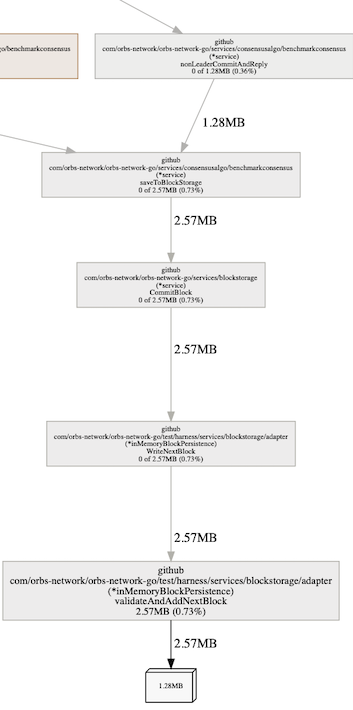
The shorter one, in blue, which has an edge connecting it to the entire system is inMemoryBlockPersistance . That name also explains the ‘leak’ we imagined we have. This is the data backend, which is storing all data in memory and not persisting to disk. Whats nice to note is that we could see immediately that it is holding two large objects. Why two? Because we can see the object is of size 1.28MB and the function is retaining 2.57MB, meaning two of them.
The problem is well understood at this point. We could have used delve (the debugger) to see that this is the array holding all blocks for the in-memory persistence driver we have.
So what could we fix?
Well, that sucked, it was a human error. While the process was educating (and sharing is caring), we did not get any better, or did we?
There was one thing that still ‘smelled’ about this heap information. The deserialized data was taking up too much memory, why 142MB for something that should be taking substantially less? . . pprof can answer that — actually, it exists to answer such questions exactly.
To look into the annotated source code of the function, we will run list lazy. We use lazy, as the function name we are looking for is lazyCalcOffsets() and we know no other functions in our code begin with lazy. Typing list lazyCalcOffsets would work as well of course.
We can see two interesting pieces of information. Again, remember that pprof heap profile samples information about allocations. We can see that both the flat and the cum numbers are the same. This indicates that the memory allocated is also retained by these allocation points.
Next, we can see that the make() is taking some memory. That makes sense, it is the pointer to the data structure. Yet we also see the assignment at line 43 is taking up memory, meaning it creates an allocation.
This educated us about maps, where an assignment to a map is not a straightforward variable assignment. This article goes into great detail on how map works. In short a map has an overhead, and the more elements the bigger this overhead is going to ‘cost’ when comparing to a slice.
The following should be taken with a grain of salt: It would be okay to say that using a map[int]T, when the data is not sparse or can be converted to sequential indices, should usually be attempted with a slice implementation if memory consumption is a relevant consideration. Yet, a large slice, when expanded, might slow down an operation, where in a map this slowdown will be negligible. There is no magic formula for optimizations.
In the code above, after checking how we used that map, we realized that while we imagined it to be a sparse array, it came out as not so sparse. This matches the above argument and we could immediately see that a small refactor of changing the map to a slice is actually possible, and might make that code more memory efficient. So we changed it to:
As simple as that, instead of using a map we are now using a slice. Because of the way we receive the data which is lazy loaded into it, and how we later access that data, other than these two lines and the struct holding that data, no other code change was required. What did it do to the memory consumption?
Let’s look at the benchcmp for just a couple of tests
The read tests initialize the data structure, which creates the allocations. We can see that runtime improved by ~30%, allocations are down by 50% and memory consumption by >90% (!)
Since the map, now-slice, was never filled with a lot of items, the numbers pretty much show what we will see in production. It depends on the data entropy, but there may be cases where both allocations and memory consumption improvements would have been even greater.
Looking at pprof again, and taking a heap profile from the same test we will see that now the memory consumption is in fact down by ~90%.
The takeaway will be that for smaller data sets, you shouldn’t use maps where slices would suffice, as maps have a large overhead.
Full core dump
As mentioned, this is where we see the biggest limitation with tooling right now. When we were investigating this issue we got obsessed with being able to get to the root object, without much success. Go evolves over time at a great pace, but that evolution comes with a price in the case of the full dump or memory representation. The full heap dump format, as it changes, is not backwards compatible. The latest version described here and to write a full heap dump, you can use debug.WriteHeapDump().
Albeit right now we do not find ourselves ‘stuck’ because there is no good solution for exploring full dumps. pprof answered all our questions until now.
Do note, the internet remembers a lot of information which is no longer relevant. Here are some things you should ignore if you are going to try and open a full dump yourself, as of go1.11:
- There is no way to open and debug a full core dump on MacOS, only Linux.
- The tools at https://github.com/randall77/hprof are for Go1.3, there exists a fork for 1.7+ but it does not work properly either (incomplete).
- viewcore at https://github.com/golang/debug/tree/master/cmd/viewcore does not really compile. It is easy enough to fix (packages in the internal are pointing to golang.org and not github.com), but, it does not work either, not on MacOS, maybe on Linux.
- Also https://github.com/randall77/corelib fails on MacOS
pprof UI
One last detail to be aware of when it comes to pprof, is its UI feature. It can save a lot of time when beginning an investigation into any issue relating to a profile taken with pprof.
go tool pprof -http=:8080 heap.outAt that point it should open the web browser. If it does not then browse to the port you set it to. It enables you to change the options and get the visual feedback much faster than you can from the command line. A very useful way to consume the information.
The UI actually got me familiar with the flame graphs, which expose culprit areas of the code very quickly.
Conclusion
Go is an exciting language with a very rich toolset, there is a lot more you can do with pprof. This post does not touch CPU profiling at all, for example.
Some other good reads:
- https://rakyll.org/archive/ — I believe this to be one of the go contributors around performance monitoring, a lot of good posts at her blog
- https://github.com/google/gops — written by JBD (who runs rakyll.org), this tool warrants its own blog post.
- https://medium.com/@cep21/using-go-1-10-new-trace-features-to-debug-an-integration-test-1dc39e4e812d —
go tool tracewhich is around CPU profiling, this is a great post about that profiling feature.
原文地址:How I investigated memory leaks in Go using pprof on a large codebase
 CFC4N的博客 由 CFC4N 创作,采用 署名—非商业性使用—相同方式共享 4.0 进行许可。基于https://www.cnxct.com上的作品创作。转载请注明转自:How I investigated memory leaks in Go using pprof on a large codebase