前置知识
- 浏览器同源安全策略
- WebSocket\TCP通讯协议
- HTTPS TLS 握手机制
- CA证书信任链
- strace、dtruss系统调用动态跟踪
- keychain安全机制
- macOS错误日志体系
背景
前段时间接了一个项目—-MOA,一款安装在macOS、Win办公电脑软件,是公司内部安全管理客户端,用来保护员工PC安全的软件。
我之前没有接触过macOS的开发,对objective-C(以下简称OC)语言也不熟悉,我这边的几个研发兄弟也一样,都是做Linux C、C++出身,对于这个陌生的领域,他们倒是不拒绝,很乐意去尝试。
在MOA新的版本中,需要具备与SSO单点登陆系统联动,控制内网SSO的准入功能,研发开发完成后,进行了灰度部署。 在灰度时,遇到一个BUG,浏览器的websocket无法与本地wss服务通讯,遇到tls handshake的错误,导致很多人无法登陆SSO,无法正常办公。
研发兄弟们也都是忙于熟悉OC语言,熟悉macOS的运行机制,忙于做业务功能开发,没时间排查这问题,以至于这BUG导致项目延期两周,影响上线进度。产品经理也在周会上表达了不满,开始对研发的技术能力产生怀疑。。。又到了拯救地球的时刻了,我决定来查一下这BUG。
运行机制介绍
关于这个SSO的通讯机制,工作过程是这样的:
假设:SSO的地址是https://sso.mt.com,MOA监听的地址是localhost.moa.mt.com
- MOA进程创建HTTP SERVER,监听loopback地址的某端口;
- 在用户打开浏览器登陆SSO时,SSO的域名会返回一段JS给浏览器;
- 浏览器执行后,会通过Websocket的方式连接loopback的这个端口,进行通讯;
那么问题来了,这种场景下,除了Websocket还有其他方式吗?
浏览器的同源策略对WS、WSS协议有影响吗?
对浏览器安全比较了解的同学很容易就给出了答案,走Websocket是最合适的方案,同源策略并不对Websocket做限制。 但是,浏览器的当前页面的协议是HTTPS时,Websocket也必须是TLS协议才行,也就是说对应WSS协议。
在macOS上开启Websocket,并且还要支持TLS通讯加密,需要在macOS上做证书私钥的部署,我们RD同学考虑到私钥泄露的风险,决定走自签CA证书的方式,在MOA部署时,将CA证书写入到macOS的Keychain根证书链中。 只不过这一步需要弹出KeyChain Access钥匙串访问的授权密码窗口,让用户授权。
现象
在SSO阻断功能的版本灰度后,收到其他部门的反馈,有好多同事的电脑显示SSO无法与MOA通讯,重启电脑后就好了。一共灰度一百多个人,出问题的就有四五个,而且不知道如何重现这个BUG。这就很让人头疼,我为了重现,尝试可很多办法,安装、卸载、再安装、再卸载,循环往复各种尝试重现,这个BUG终于重现了,但我也不知道具体的重现办法。
从技术上描述这个BUG是这样的,macOS上浏览器的https://sso.mt.com/xxx的Websocket无法连接到本地监听的localhost.moa.mt.com地址,报告网络错误。 对于这种错误,稍微对网络通讯debug的同学,都知道用tcpdump或者wireshark来抓包分析,抓到的数据包截图如下:
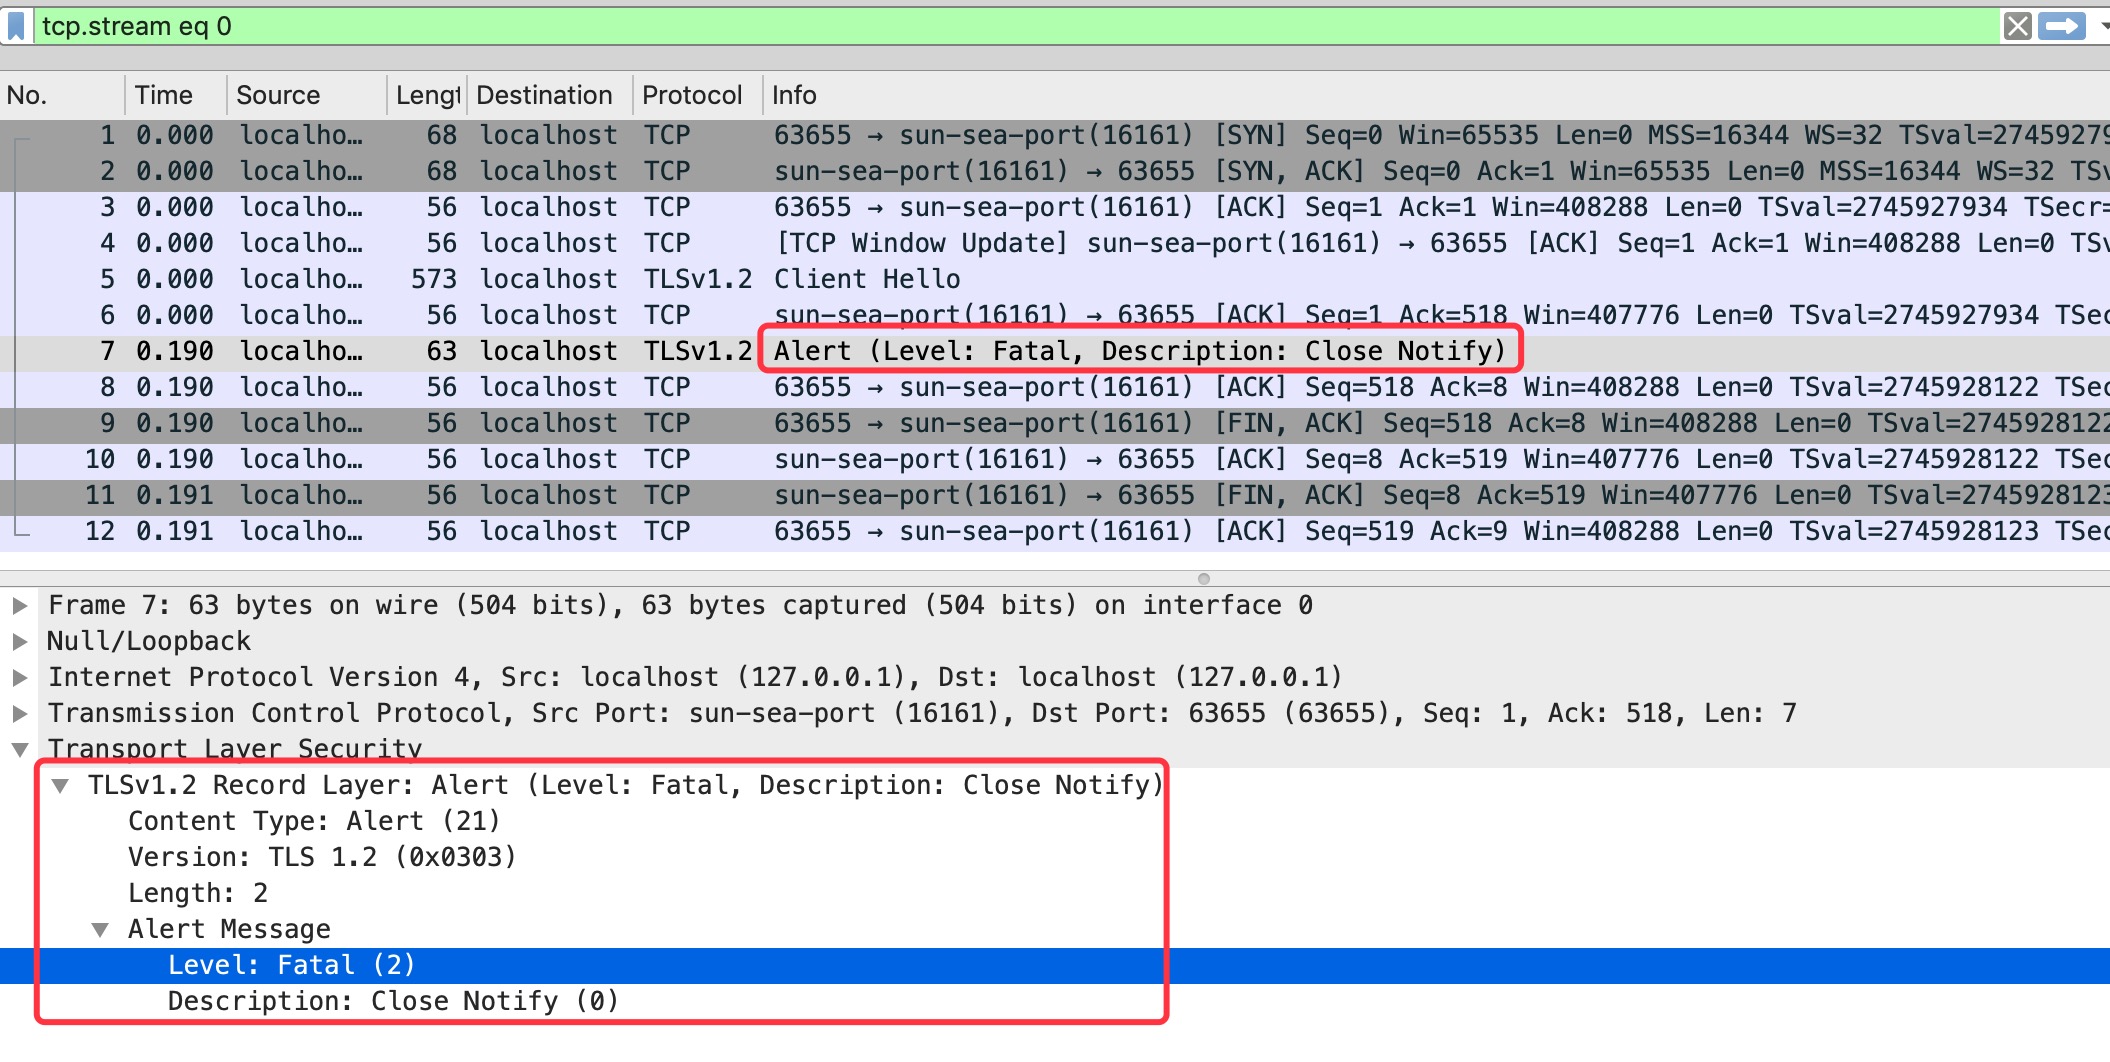
从这张通讯图上,你能发现问题出在哪了吗? TLS握手到哪个阶段了?谁先关闭的socket?关闭之前都做了什么通讯?
Frame 7: 63 bytes on wire (504 bits), 63 bytes captured (504 bits) on interface 0
Null/Loopback
Internet Protocol Version 4, Src: localhost (127.0.0.1), Dst: localhost (127.0.0.1)
Transmission Control Protocol, Src Port: sun-sea-port (16161), Dst Port: 63655 (63655), Seq: 1, Ack: 518, Len: 7
Transport Layer Security
    TLSv1.2 Record Layer: Alert (Level: Fatal, Description: Close Notify)
        Content Type: Alert (21)
        Version: TLS 1.2 (0x0303)
        Length: 2
        Alert Message
            Level: Fatal (2)
Description: Close Notify (0)机智如你,是Server给Client发了Level: Fatal, Description: Close Notify错误后,直接发了FIN包,进行关闭TCP SOCKET。
TLS Fatal Alert Close Notify
什么是TLS handshakeFatal Close Notify错误?第一次见到这个错吧?别担心,我也是。。。为什么在TLS 握手时,Client发了Client Hello后,Server没回Server Hello?而是回了这个错误?
在Openssl的文档SSL_shutdown – shut down a TLS/SSL connection 说明中,找到了这个错误的描述
SSL_shutdown() shuts down an active TLS/SSL connection. It sends the close_notify shutdown alert to the peer.
SSL_shutdown() tries to send the close_notify shutdown alert to the peer. Whether the operation succeeds or not, the SSL_SENT_SHUTDOWN flag is set and a currently open session is considered closed and good and will be kept in the session cache for further reuse.
Note that SSL_shutdown() must not be called if a previous fatal error has occurred on a connection i.e. if SSL_get_error() has returned SSL_ERROR_SYSCALL or SSL_ERROR_SSL.
从openssl官方文档中的SSL_shutdown函数描述里可以找到close_notify的介绍,当调用SSL_shutdown()函数后,将发送close_notify到对应的peer中。不管是client还是server,都可以发送这个错误。
在SSL_alert_type_string函数的介绍如下:
A warning alert is sent, when a non-fatal error condition occurs. The "close notify" alert is sent as a warning alert. Other examples for non-fatal errors are certificate errors ("certificate expired", "unsupported certificate"), for which a warning alert may be sent. (The sending party may however decide to send a fatal error.) The receiving side may cancel the connection on reception of a warning alert on it discretion.
Several alert messages must be sent as fatal alert messages as specified by the TLS RFC. A fatal alert always leads to a connection abort.
发送方可以决定是否发送Fatal级别的错误,在我们抓包的数据来看,是Moa Client(也就是说Server端)发送了Fatal级别的错误,原因是可能因为certificate expired、unsupported certificate"等等。但具体的错误,还是需要继续排查确认。
排查
那么,既然知道了TLS handshake的Fatal Close Nofity错误是服务端发起的,那么为什么呢?服务端的进程发生了什么问题?这如何排查?进程不能重启,重启后BUG现象就丢失了。
引用IBM developerworks上的一句话:
有时候,需要了解在应用程序内部正在发生的情况。例如,应用程序可能会运行失败,而又没有显示有帮助的错误消息,或者系统服务没有按照预期的方式运行。在这些情况下,您可能不掌握应用程序源代码,因此无法通过传统的调试过程寻找问题的原因。跟踪提供了一种替代方法。
在进行跟踪时,监视应用程序和操作系统之间的交互,常常会检查应用程序在执行期间调用的操作系统函数。
通过跟踪应用程序,可以查明以下方面的情况:
- 内存使用量和映射内存的调用
- 在执行期间打开和关闭的文件
- 对不同文件的读和写操作
- 为给定的应用程序装载的库
对于遇到的这个问题,我们要想了解到TLS Close Notify之前,都做了些什么操作,正因为我们程序不能重启,不知道如何重现,所以动态跟踪系统调用的做法最符合我们需求。
Linux strace
在Linux上,我们常用strace来对进程进行系统调用的跟踪探测。比如下面的例子
root@cnxct:~#strace -ff -tt -s 1000 -o 111.log -p 800
00:08:40.417260 futex(0x1ddbf08, FUTEX_WAIT_PRIVATE, 0, NULL) = 0
00:08:43.380903 futex(0x1ddbf20, FUTEX_WAIT_PRIVATE, 2, NULL) = 0
00:08:43.381001 setsockopt(232, SOL_TCP, TCP_NODELAY, [1], 4) = -1 EOPNOTSUPP (Operation not supported)
00:08:43.381053 gettid()                = 9757
00:08:43.381077 setsockopt(232, SOL_SOCKET, SO_KEEPALIVE, [1], 4) = 0
00:08:43.381102 openat(AT_FDCWD, "/dev/urandom", O_RDONLY) = 252
00:08:43.381134 read(252, "K8\232Nl\26\rU\354\312\221\260\20563+v=\367\372\371\317W\f>.\304\221\342B$\375", 32) = 32
00:08:43.381162 close(252)              = 0
00:08:43.381603 recvfrom(232, "\22\0\0\0", 4, MSG_DONTWAIT, NULL, NULL) = 4
00:08:43.381629 recvfrom(232, "\3SET NAMES utf8mb4", 18, MSG_DONTWAIT, NULL, NULL) = 18
能看到,strace的结果中,会有当前系统的CPU时间、syscall函数、参数、返回值等,有了系统时间,则会很方便的跟其他调试信息关联。
macOS dtruss
在macOS上,也有想对应的工具,dtruss,之前调试时,用过几次,命令参数、输出结果跟strace差别太大,总是不习惯。 现在遇到问题了,逃不开,只好开始学习这个工具的使用。
参数上
cfc4n@cnxct-mt:~$ dtruss
USAGE: dtruss [-acdefholLs] [-t syscall] { -p PID | -n name | command | -W name }

          -p PID          # examine this PID
          -n name         # examine this process name
          -t syscall      # examine this syscall only
          -W name         # wait for a process matching this name
          -a              # print all details
          -c              # print syscall counts
          -d              # print relative times (us)
          -e              # print elapsed times (us)
          -f              # follow children
          -l              # force printing pid/lwpid
          -o              # print on cpu times
          -s              # print stack backtraces
          -L              # don't print pid/lwpid
          -b bufsize      # dynamic variable buf size
   eg,
       dtruss df -h       # run and examine "df -h"
       dtruss -p 1871     # examine PID 1871
       dtruss -n tar      # examine all processes called "tar"
       dtruss -f test.sh  # run test.sh and follow children
从参数上来看,
-p PID、-n name都是选择跟踪的目标的-c、-d、-o等参数是统计对应系统调用执行时占用的CPU时间,在性能分析的场景下很有用。-s参数是打印系统调用对应的函数调用栈,这个参数对本次bug的排查会很有帮助。
工具参数熟悉后,整理思路开始跟踪吧。
BUG对应的系统调用范围确定
在我们去触发BUG时,程序本身也还在运行,在执行其他业务逻辑。那我们如何确定bug产生的过程对应的系统调用记录范围?
系统调用执行时的时间
前面提到,在Linux平台上,strace的日志会带有系统当前时间,其他的检测软件中也会有记录系统时间,这样关联就比较方便。但macOS平台上,dtruss是没有这个系统当前时间输出的,这样就没法便捷的关联BUG时间段,没法确定syscall日志的范围,很头疼。
比如tcpdump或wireshark捕获的网络通讯包中,也会有系统时间,哪怕没法跟dtruss日志关联,但也还是要抓包捕获,来确认BUG确实产生了。开tcpdump,选择loopback网卡(因为是127.0.0.1这个回环网址,所以是loopback网卡),设定参数port 16161,开启嗅探,同时开始重现BUG。
系统syscall的API入手关联
在wireshark的分析中,确认BUG重现后,着手分析dtruss日志。
从我们研发的经验上考虑,浏览器向MOA发起wss TCP连接时,wss server会去调用accept系统调用来处理,那么我们只要确定在大约的时间段里,找到accept的syscall,就能定位到这个bug产生最开始的入口点。
cfc4n@cnxct-mt:~$ dtruss -p 78158
dtrace: system integrity protection is on, some features will not be available
dtrace: failed to initialize dtrace: DTrace requires additional privileges
cfc4n@cnxct-mt:~$ please dtruss -p 78158
Password:
dtrace: system integrity protection is on, some features will not be available
SYSCALL(args)        = return
workq_kernreturn(0x40, 0x700005CCEB80, 0x1)      = 0 Err#-2
kevent_qos(0xFFFFFFFFFFFFFFFF, 0x7FFEE0E63920, 0x1)      = 0 0
workq_kernreturn(0x40, 0x700005CCEB80, 0x1)      = 0 Err#-2
workq_kernreturn(0x40, 0x700005CCEB80, 0x1)      = 0 Err#-2
accept(0x4, 0x700005CCE7A0, 0x700005CCE79C)      = 25 0
fcntl(0x19, 0x4, 0x4)        = 0 0
setsockopt(0x19, 0xFFFF, 0x1022)         = 0 0
kevent_id(0x6000036A8500, 0x700005CCEB80, 0x0)       = 1 0
thread_selfid(0x0, 0x0, 0x0)         = 21736566 0
lstat64("/Applications/Firefox.app/Contents/Resources\0", 0x700005D50F70, 0x0)         = -1 Err#2
open("/Applications/MOA.app/Contents/Resources/MOA.app/Contents/Resources/server.p12\0", 0x0, 0x1B6)       = 26 0
fstat64(0x1A, 0x700005D512B0, 0x0)       = 0 0
dtrace: error on enabled probe ID 2174 (ID 168: syscall::read:return): invalid kernel access in action #12 at DIF offset 68
close(0x1A)      = 0 0
open("/Users/cfc4n/Library/Keychains/login.keychain-db\0", 0x0, 0x0)       = 27 0
__mac_syscall(0x7FFF7833ACD0, 0x52, 0x700005D4F9E0)      = 0 0
lstat64("/Users/cfc4n/Library/Keychains/login.keychain-db.sb-ad1d361c-gMs51v\0", 0x700005D4FC48, 0x0)      = 0 0
fstatfs64(0x1B, 0x700005D4FC48, 0x0)         = 0 0
open_dprotected_np(0x600003BFA080, 0xB01, 0xFFFFFFFFFFFFFFFF)        = -1 Err#17
open_dprotected_np(0x600003BFA080, 0x901, 0xFFFFFFFFFFFFFFFF)        = 28 0
fcntl(0x1B, 0x30, 0x1)       = 0 0
fcntl(0x1C, 0x30, 0x1)       = 0 0
fcntl(0x1C, 0x4C, 0x1)       = 0 0
__mac_syscall(0x7FFF7833ACD0, 0x53, 0x700005D4EFE8)      = 0 0
fstat64_extended(0x1C, 0x700005D4F1A8, 0x7FD4A3D4CE10)       = 0 0
fchmod_extended(0x1C, 0x1F5, 0x14)       = 0 0
fstat64(0x1C, 0x700005D4EF50, 0x0)       = 0 0
fchflags(0x1C, 0x0, 0x0)         = 0 0
fchown(0x1C, 0x1F5, 0x14)        = 0 0
fchmod(0x1C, 0x1A4, 0x0)         = 0 0
fsetattrlist(0x1C, 0x700005D4F000, 0x700005D4EFE0)       = 0 0
fstat64(0x1B, 0x700005D4FBA0, 0x0)       = 0 0
fstat64_extended(0x1C, 0x700005D4FC48, 0x7FD4A3D4CE10)       = 0 0
close(0x1B)      = 0 0
close(0x1C)      = 0 0
utimes("/Users/cfc4n/Library/Keychains/login.keychain-db.sb-ad1d361c-gMs51v\0", 0x0, 0x0)      = 0 0
rename("/Users/cfc4n/Library/Keychains/login.keychain-db.sb-ad1d361c-gMs51v\0", "/Users/cfc4n/Library/Keychains/login.keychain-db\0")        = 0 0
flock(0x1A, 0x8, 0x0)        = 0 0
close(0x1A)      = 0 0
open("/Applications/MOA.app/Contents/Resources/MOA.app/Contents/Info.plist\0", 0x0, 0x1B6)         = 26 0
fsync(0x1B, 0x0, 0x0)        = 0 0
close(0x1B)      = 0 0
lstat64("/Users/cfc4n/Library/Keychains/login.keychain-db.sb-ad1d361c-rmdB2z\0", 0x700005D4F988, 0x0)      = 0 0
stat64_extended(0x600003BF5D60, 0x700005D4F988, 0x7FD4A3F210C0)      = 0 0
chmod_extended(0x600003BF5D60, 0x1F5, 0x14)      = 0 0
lstat64_extended(0x600000299F00, 0x7FD4A3F20FC8, 0x7FD4A3F210C0)         = 0 0
open("/Users/cfc4n/Library/Keychains/login.keychain-db\0", 0x0, 0x0)       = 27 0
workq_kernreturn(0x100, 0x700005D51B80, 0x2)         = 0 Err#-2
getentropy(0x700005D51780, 0x20, 0x0)        = 0 0
getentropy(0x700005D517D0, 0x40, 0x0)        = 0 0
kevent_id(0x6000036BE600, 0x700005C4AD80, 0x1)       = 0 0
kevent_id(0x6000036BE600, 0x700005C4AD50, 0x1)       = 0 0
dtrace: error on enabled probe ID 2172 (ID 170: syscall::write:return): invalid kernel access in action #12 at DIF offset 68
kevent_id(0x6000036B1F80, 0x700005C4B6F0, 0x1)       = 0 0
workq_kernreturn(0x100, 0x700005D51B80, 0x2)         = 0 Err#-2
kevent_id(0x6000036A8500, 0x700005C4BB80, 0x1)       = 0 0
close(0x19)      = 0 0
workq_kernreturn(0x100, 0x700005C4BB80, 0x1)         = 0 Err#-2
bsdthread_ctl(0x100, 0x0, 0x2DE13)       = 0 0
workq_kernreturn(0x20, 0x0, 0x1)         = 0 0
workq_kernreturn(0x100, 0x700005D51B80, 0x1) = 0 Err#-2(数据有删减)从上面的dtruss日志来看,accept的syscall很显眼accept(0x4, 0x700005CCE7A0, 0x700005CCE79C) = 25 0,那么,如何来理解这段日志呢?
macOS的syscall系统调用也是跟unix的一致,参考BSD System Calls 手册
ACCEPT(2) BSD System Calls Manual

NAME
     accept -- accept a connection on a socket

SYNOPSIS
     #include <sys/socket.h>

     int
     accept(int socket, struct sockaddr *restrict address,
         socklen_t *restrict address_len);

RETURN VALUES
The call returns -1 on error and the global variable errno is set to
indicate the error.  If it succeeds, it returns a non-negative integer
that is a descriptor for the accepted socket.从这个syscall的说明来看,参数部分并不重要,重要的是RETURN VALUES的部分,这是TCP SOCKET连接后的所属FD文件描述符,也就是我们BUG重现时,这个网络连接在这个MOA进程中的FD。
BUG出现的对应的accept
找到BUG重现后的FD,那么再找到FD被关闭的地方即可。从dtruss的日志accept(0x4, 0x700005CCE7A0, 0x700005CCE79C) = 25 0来看,这个FD是25,聪明的你立刻就想到,只要找到close的地方就能确定到BUG出现的syscall日志范围。
BUG出现的对应的close
直接搜索close的系统调用吧,很明显在close(0x19) = 0 0就是,只不过十进制的 25 被显示成十六进制的0x19了。
确定BUG出现的范围
对于这个BUG来说,已经确定了其产生对应的syscall日志范围,那么剩下的事情只要顺着close的地方倒推往上来找。
跟踪
从上面的dtruss结果来看,并没有找到准确的TCP SOCKET write的系统调用,只看到几处dtrace: error on enabled probe ID 2172 (ID 170: syscall::write:return): invalid kernel access in action #12 at DIF offset 68 的错误。的错误,字面上理解,无法启用相关进程的syscall:write的探测。那么我们将无法定位到到底是哪里的syscall向TCP SOCKET的FD里写入了Fatal Close Notify
回到dtruss的参数中,可以看到还有一个参数-s用来打印程序运行的stack backtraces。进行重新重现BUG:
cfc4n@cnxct-mt:~$ please dtruss -p 78158 -adfs
Password:
dtrace: system integrity protection is on, some features will not be available

    PID/THRD  RELATIVE  ELAPSD    CPU SYSCALL(args)          = return
78158/0x1527e26:     11190      88      2 bsdthread_ctl(0x100, 0x0, 0x1335B)         = 0 0

              libsystem_kernel.dylib`__bsdthread_ctl+0xa
              libdispatch.dylib`_dispatch_set_priority_and_mach_voucher_slow+0xa0
              libdispatch.dylib`_dispatch_set_priority_and_voucher_slow+0xc9
              libdispatch.dylib`_dispatch_mach_msg_invoke+0x282
              libdispatch.dylib`_dispatch_lane_serial_drain+0x10c
              libdispatch.dylib`_dispatch_mach_invoke+0x1e1
              libdispatch.dylib`_dispatch_workloop_worker_thread+0x256
              libsystem_pthread.dylib`_pthread_wqthread+0x1a5
              libsystem_pthread.dylib`start_wqthread+0xd
              0x10ef9e000

78158/0x1527e26:     11276     106     23 workq_kernreturn(0x20, 0x0, 0x1)       = 0 0

              libsystem_kernel.dylib`__workq_kernreturn+0xa
              libdispatch.dylib`_dispatch_root_queue_poke_slow+0xac
              LaunchServices`LSNotificationReceiver::receiveNotificationFromServer(_xpc_connection_s*, void*)+0x3a3
              LaunchServices`___ZN22LSNotificationReceiver23getNotificationListenerEv_block_invoke.10+0x184
              libxpc.dylib`_xpc_connection_call_event_handler+0x38
              libxpc.dylib`_xpc_connection_mach_event+0x3a5
              libdispatch.dylib`_dispatch_client_callout4+0x9
              libdispatch.dylib`_dispatch_mach_msg_invoke+0x1b4
              libdispatch.dylib`_dispatch_lane_serial_drain+0x10c
              libdispatch.dylib`_dispatch_mach_invoke+0x1e1
              libdispatch.dylib`_dispatch_workloop_worker_thread+0x256
              libsystem_pthread.dylib`_pthread_wqthread+0x1a5
              libsystem_pthread.dylib`start_wqthread+0xd
              0x10ef9e000

... //很多,有删减

78158/0x152e9e7:       294     101     21 accept(0x4, 0x700005CCE7A0, 0x700005CCE79C)        = 25 0

              libsystem_kernel.dylib`__accept+0xa
              itsec-agent`0x000000010edc0023+0x44
              libdispatch.dylib`_dispatch_client_callout+0x8
              libdispatch.dylib`_dispatch_continuation_pop+0x19e
              libdispatch.dylib`_dispatch_source_invoke+0x808
              libdispatch.dylib`_dispatch_lane_serial_drain+0x10c
              libdispatch.dylib`_dispatch_lane_invoke+0x181
              libdispatch.dylib`_dispatch_workloop_worker_thread+0x256
              libsystem_pthread.dylib`_pthread_wqthread+0x1a5
              libsystem_pthread.dylib`start_wqthread+0xd
78158/0x152ecde:      1209      37     31 open("/Users/cfc4n/Library/Keychains//.fl34AC2A0A\0", 0x200, 0x124)      = 26 0

              libsystem_kernel.dylib`__open+0xa
              Security`Security::DbModifier::modifyDatabase()+0x5d
              Security`Security::AppleDatabase::dataInsert(Security::DbContext&, unsigned int, cssm_db_record_attribute_data const*, Security::CssmData const*)+0x54
              Security`Security::DatabaseSession::DataInsert(long, unsigned int, cssm_db_record_attribute_data const*, Security::CssmData const*, cssm_db_unique_record*&)+0xbb
              Security`cssm_DataInsert(cssm_dl_db_handle, unsigned int, cssm_db_record_attribute_data const*, cssm_data const*, cssm_db_unique_record**)+0x68
              Security`CSSM_DL_DataInsert+0x88
              Security`SSDatabaseImpl::ssInsert(unsigned int, cssm_db_record_attribute_data const*, cssm_data const*)+0xc5
              Security`SSCSPDLSession::makeReferenceKey(SSCSPSession&, unsigned int, Security::CssmKey&, SSDatabase&, unsigned int, Security::CssmData const*)+0xb09
              Security`SSCSPSession::UnwrapKey(unsigned long long, Security::Context const&, Security::CssmKey const*, Security::CssmKey const&, unsigned int, unsigned int, Security::CssmData const*, cssm_resource_control_context const*, Security::CssmKey&, Security::CssmData&, unsigned long long)+0x17a
              Security`non-virtual thunk to SSCSPSession::UnwrapKey(unsigned long long, Security::Context const&, Security::CssmKey const*, Security::CssmKey const&, unsigned int, unsigned int, Security::CssmData const*, cssm_resource_control_context const*, Security::CssmKey&, Security::CssmData&, unsigned long long)+0x21
              Security`cssm_UnwrapKey(long, unsigned long long, cssm_context const*, cssm_key const*, cssm_key const*, unsigned int, unsigned int, cssm_data const*, cssm_resource_control_context const*, cssm_key*, cssm_data*, unsigned long long)+0xd0
              Security`CSSM_UnwrapKey+0xc7
              Security`P12Coder::safeContentsParse(cssm_data const&, SecNssCoder&)+0xd2c
              Security`impExpPkcs12Import+0x8a0
              Security`SecKeychainItemImport+0xd30
              Security`SecPKCS12Import+0x100
              itsec-agent`0x000000010edd8efe+0x10b
              itsec-agent`0x000000010ed9f5b8+0x36
              itsec-agent`0x000000010edce367+0x39
              itsec-agent`0x000000010edce297+0x38

78158/0x152ecde:     15213      33     30 lstat64("/Users/cfc4n/Library/Keychains/login.keychain-db.sb-ad1d361c-3plX5x\0", 0x700005C49A78, 0x0)        = 0 0

              libsystem_kernel.dylib`lstat$INODE64+0xa
              Security`Security::DbModifier::commit()+0xda3
              Security`Security::AppleDatabase::dataInsert(Security::DbContext&, unsigned int, cssm_db_record_attribute_data const*, Security::CssmData const*)+0xb1
              Security`Security::DatabaseSession::DataInsert(long, unsigned int, cssm_db_record_attribute_data const*, Security::CssmData const*, cssm_db_unique_record*&)+0xbb
              Security`cssm_DataInsert(cssm_dl_db_handle, unsigned int, cssm_db_record_attribute_data const*, cssm_data const*, cssm_db_unique_record**)+0x68
              Security`CSSM_DL_DataInsert+0x88
              Security`SSDatabaseImpl::ssInsert(unsigned int, cssm_db_record_attribute_data const*, cssm_data const*)+0xc5
              Security`SSCSPDLSession::makeReferenceKey(SSCSPSession&, unsigned int, Security::CssmKey&, SSDatabase&, unsigned int, Security::CssmData const*)+0xb09
              Security`SSCSPSession::UnwrapKey(unsigned long long, Security::Context const&, Security::CssmKey const*, Security::CssmKey const&, unsigned int, unsigned int, Security::CssmData const*, cssm_resource_control_context const*, Security::CssmKey&, Security::CssmData&, unsigned long long)+0x17a
              Security`non-virtual thunk to SSCSPSession::UnwrapKey(unsigned long long, Security::Context const&, Security::CssmKey const*, Security::CssmKey const&, unsigned int, unsigned int, Security::CssmData const*, cssm_resource_control_context const*, Security::CssmKey&, Security::CssmData&, unsigned long long)+0x21
              Security`cssm_UnwrapKey(long, unsigned long long, cssm_context const*, cssm_key const*, cssm_key const*, unsigned int, unsigned int, cssm_data const*, cssm_resource_control_context const*, cssm_key*, cssm_data*, unsigned long long)+0xd0
              Security`CSSM_UnwrapKey+0xc7
              Security`P12Coder::safeContentsParse(cssm_data const&, SecNssCoder&)+0xd2c
              Security`impExpPkcs12Import+0x8a0
              Security`SecKeychainItemImport+0xd30
              Security`SecPKCS12Import+0x100
              itsec-agent`0x000000010edd8efe+0x10b
              itsec-agent`0x000000010ed9f5b8+0x36
              itsec-agent`0x000000010edce367+0x39
              itsec-agent`0x000000010edce297+0x38
... //有删减
78158/0x152e9e7:      1150      71      4 kevent_id(0x6000036BE600, 0x700005CCDD50, 0x1)         = 0 0

              libsystem_kernel.dylib`kevent_id+0xa
              libdispatch.dylib`_dispatch_event_loop_end_ownership+0x2b6
              libdispatch.dylib`_dispatch_sync_complete_recurse+0x2c
              libdispatch.dylib`_dispatch_sync_invoke_and_complete_recurse+0x5b
              libdispatch.dylib`_dispatch_sync_f_slow+0xc3
              libcorecrypto.dylib`ccrng_cryptographic_generate+0x132
              libcorecrypto.dylib`ccn_random_bits+0x2b
              libcorecrypto.dylib`ccec_projectify+0x59
              libcorecrypto.dylib`ccec_make_pub_from_priv+0xce
              libcorecrypto.dylib`ccec_generate_key_internal_fips+0xa0
              libcorecrypto.dylib`ccec_sign_internal+0x1c9
              libcorecrypto.dylib`ccec_sign+0x57
              libcorecrypto.dylib`ccec_pairwise_consistency_check+0x84
              libcorecrypto.dylib`ccec_generate_key_fips+0x21
              libcoretls.dylib`sslEcdhCreateKey+0x40
              libcoretls.dylib`SSLEncodeServerKeyExchange+0x253
              libcoretls.dylib`SSLPrepareAndQueueMessage+0x27
              libcoretls.dylib`SSLAdvanceHandshake+0xb37
              libcoretls.dylib`SSLProcessHandshakeRecordInner+0xea
              libcoretls.dylib`tls_handshake_process+0x55

dtrace: error on enabled probe ID 2172 (ID 170: syscall::write:return): invalid kernel access in action #13 at DIF offset 68
78158/0x152e9e7:      2915      11      5 kevent_id(0x6000036B1F80, 0x700005CCE6F0, 0x1)         = 0 0

              libsystem_kernel.dylib`kevent_id+0xa
              libdispatch.dylib`_dispatch_event_loop_poke+0x205
              itsec-agent`0x000000010edc2126+0x2e4
              itsec-agent`0x000000010edc9109+0x185
              itsec-agent`0x000000010edc8655+0x9d8
              itsec-agent`0x000000010edc827e+0x96
              libdispatch.dylib`_dispatch_call_block_and_release+0xc
              libdispatch.dylib`_dispatch_client_callout+0x8
              libdispatch.dylib`_dispatch_lane_serial_drain+0x25a
              libdispatch.dylib`_dispatch_lane_invoke+0x181
              libdispatch.dylib`_dispatch_workloop_worker_thread+0x256
              libsystem_pthread.dylib`_pthread_wqthread+0x1a5
              libsystem_pthread.dylib`start_wqthread+0xd
78158/0x152e9e7:      3016      17     13 close(0x19)        = 0 0

              libsystem_kernel.dylib`close+0xa
              libdispatch.dylib`_dispatch_client_callout+0x8
              libdispatch.dylib`_dispatch_continuation_pop+0x19e
              libdispatch.dylib`_dispatch_source_invoke+0x48b
              libdispatch.dylib`_dispatch_lane_serial_drain+0x10c
              libdispatch.dylib`_dispatch_lane_invoke+0x181
              libdispatch.dylib`_dispatch_workloop_worker_thread+0x256
              libsystem_pthread.dylib`_pthread_wqthread+0x1a5
libsystem_pthread.dylib`start_wqthread+0xd找到close(0x19)的地方,往上倒推几个syscall日志,可以定位到真正往TCP SOCKET 写入Fatal Close Notify的地方是在libcoretls.dylib\SSLEncodeServerKeyExchange+0x253`。 定位到服务端的密钥交换过程中,EncodeServer时出现了异常。
回到dtruss的其他日志,能看到在调用Security动态链接库中的impExpPkcs12Import方法里,有大量的/Users/cfc4n/Library/Keychains/login.keychain-db的读写。意味着MOA进程在频繁大量的读写keychain。
除了Keychain的频繁读写,还看到了大量MOA主进程的访问
78158/0x152ecde:     18541      85     31 open("/Applications/MOA.app/Contents/Resources/MOA.app/Contents/MacOS/itsec-agent\0", 0x0, 0x1B6)        = 26 0

              libsystem_kernel.dylib`__open+0xa
              Security`Security::OSXVerifier::makeLegacyHash(Security::OSXCode*, unsigned char*)+0x101
              Security`Security::OSXVerifier::OSXVerifier(Security::OSXCode*)+0x1b1
              Security`Security::KeychainCore::TrustedApplication::TrustedApplication()+0x70
              Security`Security::KeychainCore::Access::Access(std::__1::basic_string<char, std::__1::char_traits<char>, std::__1::allocator<char> > const&)+0x70
              Security`P12Coder::safeContentsParse(cssm_data const&, SecNssCoder&)+0xe02
              Security`impExpPkcs12Import+0x8a0
              Security`SecKeychainItemImport+0xd30
              Security`SecPKCS12Import+0x100
              itsec-agent`0x000000010edd8efe+0x10b
              itsec-agent`0x000000010ed9f5b8+0x36
              itsec-agent`0x000000010edce367+0x39
              itsec-agent`0x000000010edce297+0x38
              libdispatch.dylib`_dispatch_call_block_and_release+0xc
              libdispatch.dylib`_dispatch_client_callout+0x8
              libdispatch.dylib`_dispatch_lane_serial_drain+0x25a
              libdispatch.dylib`_dispatch_lane_invoke+0x181
              libdispatch.dylib`_dispatch_workloop_worker_thread+0x256
              libsystem_pthread.dylib`_pthread_wqthread+0x1a5
libsystem_pthread.dylib`start_wqthread+0xdCodeSigning是macOS的对二进制程序进行数字签名的机制,以确保进程文件没有被篡改,安全保障机制详情见:About Code Signing ,可以确认的是,MOA进程在每次accept TCP连接时,都进行了主进程的签名校验。难道程序签名校验失败了?因为频繁的重新安装进程,而这个老进程又没退出,但文件内容却被覆盖了? 可以这么怀疑,但还是需要证据证明。
但问题定位到这里,好像卡死了,我不确定Security链接库是否还会写入其他日志,也没有时间去看这个链接库的源码。 根据之前做黑盒分析的经验,决定到系统日志里找找看,macOS的系统日志的进程是console.app。
关联系统日志
在控制台中,搜索MOA的进程名itsec-agent,找BUG重现时的时间点,能看到这些报错信息,而根据dtruss中捕获的Keychains的临时文件名,也能关联得到这些日志。
默认  12:05:49.086566 +0800   itsec-agent caught CssmError: -2147416017 CSSMERR_CSP_ACL_ENTRY_TAG_NOT_FOUND
默认  12:05:49.095362 +0800   itsec-agent CSSM Exception: -2147416032 CSSMERR_CSP_OPERATION_AUTH_DENIED
默认  12:05:53.326473 +0800   itsec-agent 0x6000008ffb80 commited /Users/cfc4n/Library/Keychains/login.keychain-db.sb-dbe9e6c6-5v8ECF to /Users/cfc4n/Library/Keychains/login.keychain-db
默认  12:05:53.331646 +0800   itsec-agent CSSM Exception: -2147413719 CSSMERR_DL_INVALID_UNIQUE_INDEX_DATA
默认  12:06:01.089562 +0800   itsec-agent 0x6040008fb980 commited /Users/cfc4n/Library/Keychains/login.keychain-db.sb-dbe9e6c6-yiHh6n to /Users/cfc4n/Library/Keychains/login.keychain-db
默认  12:06:01.096920 +0800   itsec-agent CSSM Exception: -2147413719 CSSMERR_DL_INVALID_UNIQUE_INDEX_DATA
默认  12:06:01.108208 +0800   itsec-agent 0x6040008fc080 commited /Users/cfc4n/Library/Keychains/login.keychain-db.sb-dbe9e6c6-yrTtXC to /Users/cfc4n/Library/Keychains/login.keychain-db
默认  12:06:01.113267 +0800   itsec-agent CSSM Exception: -2147413719 CSSMERR_DL_INVALID_UNIQUE_INDEX_DATA
默认  12:06:01.146973 +0800   itsec-agent caught CssmError: -2147416017 CSSMERR_CSP_ACL_ENTRY_TAG_NOT_FOUND
默认  12:06:01.156853 +0800   itsec-agent CSSM Exception: -2147416032 CSSMERR_CSP_OPERATION_AUTH_DENIED
默认 12:06:01.160022 +0800 itsec-agent CSSM Exception: -2147416032 CSSMERR_CSP_OPERATION_AUTH_DENIED这些报错信息,我也是第一次见,在网上稍微搜索相关知识了解,能看到这是macOS的Openssl的类库源码中的报错信息,比如CSSMERR_DL_INVALID_UNIQUE_INDEX_DATA、CSSMERR_CSP_OPERATION_AUTH_DENIED等。
在apple的开发者社区中,看到一个相似的案例: inexplicable CSSMERR_CSP_OPERATION_AUTH_DENIED,里面提到这个错误有很多情况产生
- apple的CodeSign
- keychain证书链中的证书itemid丢失
等等,结合前面dtruss的排查结论,问题方向定位到self-sign自签CA证书上。
定位
其实,这里我的MacBook死机电脑重启了,BUG无法重现,但问题的大体方向几乎定位到了。在前面的结论下,以及搜索到的这些案例,我决定使用下面两种方式吃重现
- 删除Keychain的自签CA,模拟itemid丢失;
- 覆盖MOA主进程,让MacOS的CodeSigning机制检测失败;
对于方式一,测试结果如下
- MOA继续运行
- 删除了
KeyChain里的自签CA证书 - 重新访问这个TCP SOCKET
- 问题并没有复现,但出现了一个相近的错误
Description: Certificate Unknown,之后也是服务端发送FIN包后关闭连接。
虽然问题没有复现,但我觉得真相已经很近了,配合CodeSigning的检测问题,需要模拟主进程文件被替换的场景,我又想到一种重现方式
- 清空删除所有MOA安装包
- 打开wireshark,抓loopback网卡的port 16161端口
- 安装老版MOA,按照业务流程走一遍,确保所有功能正常
- 安装新版MOA,chrome开隐私模式(确保不用上次的COOKIE),登陆SSO
- MOA弹出申请keychain权限的窗口,点“拒绝”
- 问题重现可以从wireshark的抓包窗口中确认,看到了Tls handshake时的Fatal Close Notify错误
嗯,问题重现,BUG根本原因找到了。但Keychain的安全机制我还不太清楚,时间关系,暂时放过吧,以后有机会再研究。
解题思路
回顾整个排查过程,我并不清楚OC代码是如何写的,都是黑盒分析,完全是看系统调用syscall来知道这个软件运行的行为,定位BUG问题所在的。
有很多知识是跨平台通用的,比如网络通讯原理、动态跟踪技术、动态调试技术、syscall系统调用、二进制文件执行机制等技术,跟所在的是Windows、Linux还是macOS关系不大。
系统调用syscall跟踪软件在Win上有 Process Monitor ,我在2016年黑盒分析英雄联盟启动器时使用过,之前也没做过Windows的程序研发,只是借助Linux的解题思路找对应得替代软件而已。比如下图:
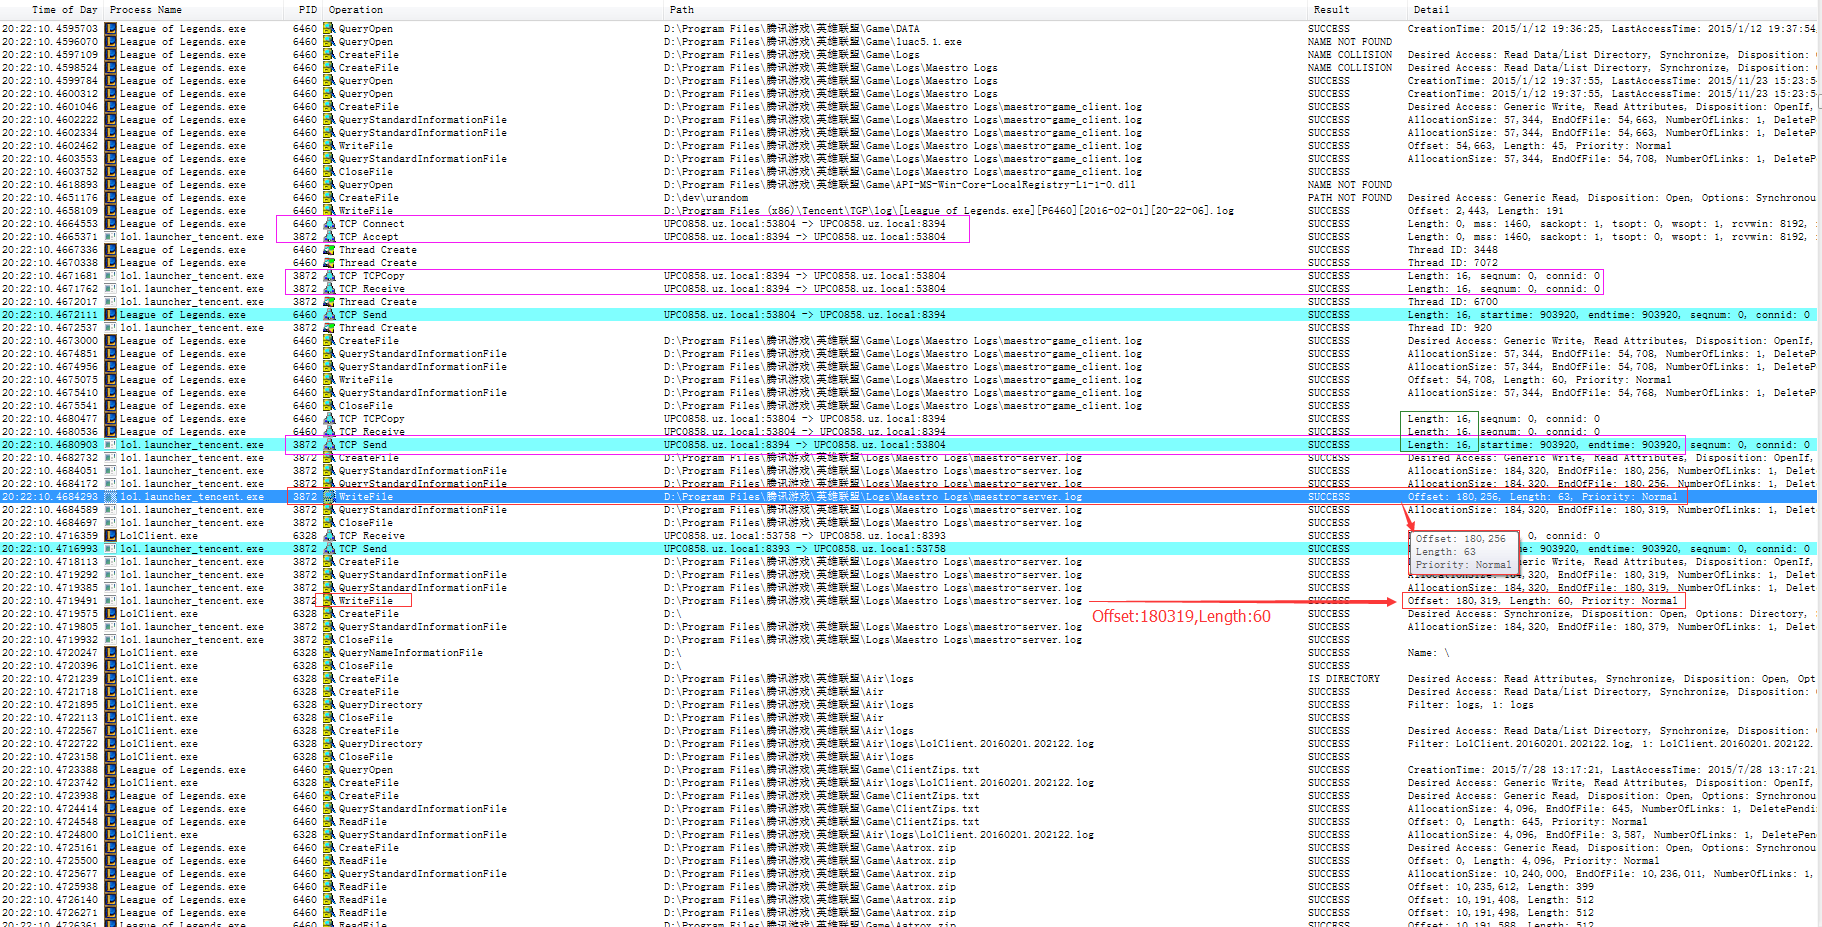
同样,这次遇到macOS的BUG也是,只要找对应得软件就好,解决问题的思路是通用的。
Linux上有strace,macOS上有dtruss,对于更详细的动态跟踪软件,还有Dtrace、SystemTap等我也在学习中,以后如果有机会,我会继续给大家分享。
通用知识
对于这种BUG的解决,重要的是解题思路,遇到问题该如何处理,如何粗略定位问题所在,从哪里入手?靠猜吗?东一锤子西一榔头的靠运气吗?
就怕你整天TCP协议栈倒背如流,操作系统知识滚瓜烂熟,垃圾回收机制如数家珍,但每次一遇到问题,就一脸懵逼、束手无策,这就很不匹配。
大部分主动学习能力并不强,都是靠事件驱动,比如有BUG产生了,才不得不去学习陌生领域的知识,去解决问题,顺便积累经验。可怕的是有部分人BUG发生就发生了,重启能解决就算,从来不关心根本原因是什么。下次遇到同类型的问题时,依旧是束手无策。
套用道友codedump的一句话知行合一(出自王阳明),珍惜每一次BUG的机会,历练自己。在解决每个问题时,是对你整个知识体系的梳理,对逻辑思维的考验,对技术技能的检查,检验自己、磨练自己、强化自己。
解决方案
- WSS的https server监听时,使用的tls证书,要走正规CA签发,避免自签self-sign的CA频繁读写keychain ,避免对keychain的root权限获取。(域名解析到127.0.0.1,拿到私钥的安全风险也很小)
- MOA升级时,先杀死老版本的所有进程,再进行安装、覆盖、启动。
- itsec-agent进程 codesign签名。
本文重点
美团点评信息安全中心招聘,职位包括不限于
- iOS/macOS技术专家
- Web应用防火墙架构师
- JAVA\golang\C++高级工程师
- 数据安全资深专家
- 数仓安全架构师
- 基础安全专家
- 风险数据挖掘专家
- IoT安全专家
- 移动安全工程师、专家
- 操作系统安全工程师、专家
更多职位信息,见:同学,我看你骨骼精奇,是干安全/研发的好苗子:https://mp.weixin.qq.com/s/9Y9bAUt51gPvy2ItiFRBCA 。
关注本BLOG微信公众号榫卯江湖,回复JD、JOBS、招聘、工作获取更多职位信息。

相似的案例
- inexplicable CSSMERR_CSP_OPERATION_AUTH_DENIED :
- Certificate-private key combo failure: https://forums.developer.apple.com/thread/99801
- Internal error (errSSLInternal) on SSLHandshake:https://forums.developer.apple.com/thread/92193
参考资料
- macOS Code Signing In Depth
- 跟踪 UNIX 应用程序的解决方案
- openssl类库的SSL_alert_type_string函数手册
- macOS平台Security类库源码的CSSMERRCSP*相关错误
- https://docs.apigee.com/api-platform/troubleshoot/runtime/ssl-handshake-failures:
- Re: inexplicable CSSMERR_CSP_OPERATION_AUTH_DENIED:
扩展知识
- http://oliveryang.net/2016/07/linux-perf-tools-tips/
- System Integrity Protection – Adding another layer to Apple’s security model
- SystemTap Beginners Guide
 CFC4N的博客 由 CFC4N 创作,采用 署名—非商业性使用—相同方式共享 4.0 进行许可。基于https://www.cnxct.com上的作品创作。转载请注明转自:TLS handshake Fatal Alert Close Notify的错误排查